Why Unusual Volume in Penny Stocks Is the Signal Every Trader Watches First
One of the best ways to develop a skill set for trading penny stocks (or learning how to trade them) is by being able to identify unusual volume just prior to major price movements. When dealing with lower-priced or higher-volatility securities, volume serves not only as confirmation for trades but can also serve as precursor indication to trade occurrence. A systematic trader will possess the skills to identify true forms of unusual volume within penny stocks, distinguish true volume from random or insignificant volume, and act outside of emotions due to the timing of trading reaction.
This guide will explain what it is like to have an unusual volume, why unusual volumes are more vital within penny stocks than any of the other markets out there, how to calculate and use Relative Volume (RVOL), what types of signal are actionable, and also what types of signals to be cautious with.
What Is a Penny Stock? Defining the Landscape
A penny stock is defined very loosely and can be thought of as any stock that trades for less than $5. A stock that trades for $4.80 and a stock that trades for $0.09 are both considered penny stocks, even though they have different prices. Other than price, the characteristics of a particular penny stock help in defining it, including low market capitalization, limited liquidity, very little analyst coverage, and extremely responsive to changes or fluctuations in both news and volume.
Because penny stocks often have small floats, meaning relatively few shares are available for public trading, even a modest increase in buying or selling activity can cause price to move dramatically. This is why volume is the primary language of penny stock trading. A stock with a normal daily volume of 200,000 shares that suddenly sees 2 million shares traded in a single session is telling you something specific: attention has arrived.
Related: Liquidity, Volume and Volatility: What Day Traders in Saudi Arabia Watch First
Relative Volume (RVOL): The Core Metric for Spotting Unusual Activity
Volume in isolation means little. A stock trading 1 million shares sounds significant until you learn it typically trades 5 million shares per day. The metric that matters is Relative Volume, widely known as RVOL.
RVOL compares a stock's current trading volume to its average volume over a set historical period, typically 10, 20, or 90 days. The formula is straightforward:
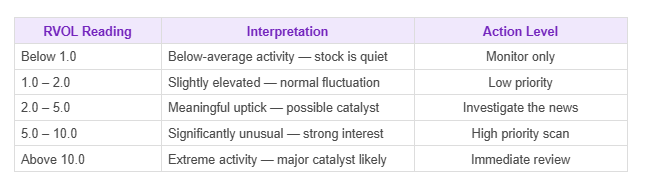
Formula: RVOL = Current Volume ÷ Average Daily Volume (over 10/20/90 days). An RVOL above 2.0 means the stock is trading at twice its normal rate. An RVOL above 5.0 is considered highly unusual and worthy of investigation.
Most professional scanning tools display RVOL in real time. Here is a quick reference for interpreting the numbers:
Related: Advanced Charts & Order Book on Raseed: Trading With Clarity
Five Types of Catalyst That Drive Unusual Volume in Penny Stocks
Unusual volume does not appear from nowhere. Every meaningful spike in penny stock activity has a reason and identifying that reason is critical before taking any position. Here are the five most common drivers:
1. News Catalysts: Earnings, Partnerships, and Announcements
A press release announcing a new contract, licensing deal, earnings surprise, or product approval can trigger enormous volume in a penny stock within minutes of publication. The key question is whether the news represents genuine business progress or is a promotional announcement designed to attract retail attention. Always cross-reference news against credible financial sources, not just company press releases.
2. Sector Headlines and Macro Momentum
When a sector gets a substantial amount of coverage from the press (i.e. biotech approvals, energy price increases, advances in AI), all stocks in that sector tend to experience increased trading volume, including penny stocks that only relate to that sector in an indirect manner. Sector driven moves are typically for short periods of time; however, they can provide significant tactical opportunities for traders who are able to identify them early enough.
3. Regulatory or Legal Developments
There are a large number of events in the biotech and pharmaceutical penny stock market that can create big changes or spikes in prices. This includes FDA approval, patent changes and regulatory actions, with these being some of the most significant events that occur in the penny stock world on an individual basis.
4. Unusual Options Activity (for listed penny stocks)
When a stock shows both unusual equity volume and unusual options volume simultaneously, it often indicates institutional or well-capitalised speculative interest. Options activity in combination with equity volume spikes is a stronger signal than equity volume alone.
5. Technical Breakouts Attracting Momentum Traders
Some volume spikes are self-generating: a stock breaks above a key resistance level, momentum traders pile in, volume increases further, and price accelerates. These breakouts are visible on charts and are one reason why understanding basic technical analysis complements volume analysis so effectively.
Related: Free Level 2 Market Data: Why It Matters in GCC
How to Use Stock Scanners to Find Unusual Volume in Real Time
Identifying unusual volume manually, scrolling through tickers one by one is neither practical nor fast enough. Professional traders use real-time stock scanners configured to surface stocks meeting specific criteria simultaneously. Here is a basic scanning setup for identifying unusual penny stock volume:
Price filter: Set minimum $0.10 and maximum $5 to isolate penny stocks
Minimum volume: Set a floor of at least 100,000 shares traded to exclude genuinely illiquid names
RVOL threshold: Filter for RVOL ≥ 3.0 to surface stocks trading at triple their normal rate or more
Price change: Add a minimum percentage move filter (e.g., +3%) to identify volume accompanied by actual price action
News filter: Cross-reference scanner results against a real-time news feed to verify catalysts
Raseed's advanced order book and charting tools give traders the real-time data infrastructure to monitor volume changes continuously, with live updates reflecting current bid-ask spreads and trade flow throughout each session.
Related: Advanced Charts & Order Book on Raseed: Trading With Clarity
The Difference Between Genuine Unusual Volume and Pump-and-Dump Activity
Not all unusual volume in penny stocks is legitimate. One of the most important skills for any trader in this space is the ability to distinguish between genuine institutional or news-driven interest and coordinated promotional activity designed to inflate a stock's price artificially before insiders sell.
Warning signs of promotional or manipulated volume include: sudden social media campaigns promoting the stock, email newsletters recommending urgent purchases, volume spikes with no corresponding news, stocks with no revenue or business activity suddenly generating interest, and promoters claiming guaranteed returns. In genuine unusual volume scenarios, there is always a traceable fundamental or technical reason for the activity.
Risk Warning: Penny stocks are among the highest-risk instruments in any market. Unusual volume can reverse as quickly as it appears. Always use limit orders, define your maximum loss before entering, and never commit more capital to a single penny stock position than you can afford to lose entirely.
Volume Before Price: The Most Important Penny Stock Principle
The central insight of volume analysis in penny stocks is that volume often leads to price. When accumulation is taking place meaning informed or well-capitalised buyers are building a position, volume tends to rise before price moves significantly. This is because large buyers cannot purchase their full intended position in a single transaction without moving the price against themselves; they accumulate gradually, creating a volume signature that precedes the price move.
Conversely, when distribution is happening, large holders selling into retail buying pressure, volume rises but price action becomes choppy or stalls despite high activity. Learning to read these patterns on a chart alongside volume data is a skill that significantly improves the quality of trade selection over time.
Related: Liquidity, Volume and Volatility: What Day Traders in Saudi Arabia Watch First
Frequently Asked Questions: Unusual Volume in Penny Stocks
What counts as 'unusual' volume in a penny stock?
A generally accepted benchmark is volume at least 2x to 3x the stock's average daily volume (RVOL ≥ 2.0 to 3.0). Above 5x is considered highly unusual and typically indicates a specific catalyst has emerged.
Should I buy a penny stock immediately when I see unusual volume?
No. High-volume activity is an indicator that you should be investigating, not necessarily a reason to buy immediately. Before taking any action, always identify the catalyst for the increase in volume, make sure that the catalyst is both legitimate (as opposed to some sort of rumor) and material (expected to have an impact), determine whether or not the price has already fully reflected any price movement due to the catalyst, and evaluate the risk before making any decision.
Can I track unusual penny stock volume on Raseed?
Yes. Raseed's platform provides real-time order book data and advanced charting with live volume indicators, giving Saudi and GCC traders the same data infrastructure that professional traders use globally.
Is penny stock trading suitable for beginners?
Penny stocks tend to have a high-risk profile, so they usually require a level of experience in trading and a thorough understanding of technical analysis (charting techniques), volume interpretation (what it means when a lot of shares are sold/purchased), and risk management to be traded successfully. Therefore, beginner traders will usually be better off using diversifying index ETFs and/or large-cap stocks as a starting point before trying penny stock strategies.
Securities brokerage services are provided by Fullerverse (SC) Limited, a security broker dealer licensed and regulated by the Financial Services Authority Seychelles (Licence No. SD152). Fullerverse is a wholly-owned subsidiary of Raseed Invest Inc. All investing involves risk. Past performance does not guarantee future results. Capital is at risk.