The Core Problem That the P/E Ratio Solves
The price of a stock listed currently is $220, which gives little to no information about whether the stock is long or short in relation to its overall value. You could have a stock priced at $5 (and have that stock be grossly overpriced) and have another stock priced at $500 (and that stock could be extremely undervalued). The number of shares outstanding is a factor that is purely an arbitrary decision made by the company itself, and it has no bearing whatsoever on the actual value of the company.
The price-to-earnings (P/E) ratio helps you understand what your paying for the company’s earnings by providing the context to help make the price meaningful. The P/E ratio is a standardised valuation metric which means you have a way to compare two companies meaningfully, regardless of their share price, size or other absolute measures of their stock prices. The P/E ratio is the most widely used stock valuation metric worldwide by financial markets.
What Is the P/E Ratio? Definition and Formula
The P/E ratio compares a company's current share price to its earnings per share (EPS, the company's annual profit divided by total shares outstanding). Formula: P/E Ratio = Share Price ÷ Earnings Per Share.
Example: Apple's share price is $220. Apple's trailing twelve-month EPS is approximately $6.50. Apple's P/E ratio is 220 ÷ 6.50 = 33.8. This means investors are paying $33.80 for every $1 of Apple's annual profit or equivalently, the market values Apple at 33.8 times its current earnings.
An earnings yield can be calculated by dividing the EPS by the market price of one share of Apple. Therefore, Apple's current P/E Ratio (33.8) translates to about a 3.0% (1/33.8) earnings yield at today’s share price (early 2026) when US 10 Year T Bonds yield approximately 4.3%. Given that Apple's earnings yield is less than the risk free rate, investors appear willing to accept this valuation based on expected future growth in Apple's earnings.
Trailing P/E vs Forward P/E: A Critical Distinction
Trailing Twelve Months P/E (TTM)
Utilizes company's true audited income from the most recent 12 month period; this is historical data (as opposed to forecasted), which can be verified and therefore is a reliable measure of earnings than projected earnings. The TASI trailing P/E ratio as at early 2026 was approximately 14.89x, very close to its 10 year average of 15.17x, implying that TASI is moderately priced rather than over- or under-valued.
Forward P/E
Uses consensus analyst estimates of the next twelve months of earnings. More useful for investment decisions because stock prices are forward-looking, they reflect expectations about the future, not confirmed historical performance. A stock with a high trailing P/E but a low forward P/E is pricing in significant earnings growth this year. If those earnings materialise, the apparent expensiveness resolves itself.
The S&P 500's forward P/E in early 2026 was approximately 21-22x, above its 25-year historical average of approximately 16-17x, reflecting expectations for continued AI-driven earnings growth across US corporations.
Related: How to Do Fundamental Analysis on US Stocks: A GCC Investor's Guide
Sector P/E Benchmarks: Context Is Everything
P/E ratios vary dramatically by industry because of structural differences in growth rates, capital intensity, and earnings predictability. A P/E that looks expensive in one sector is entirely normal in another:
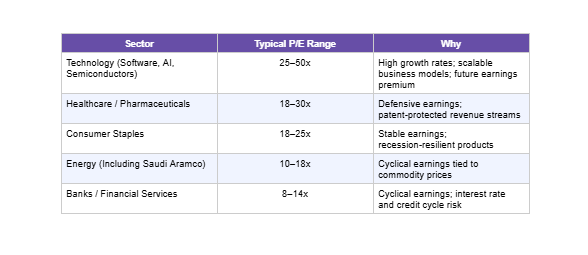
This is why comparing a software company's P/E to an oil company's P/E is meaningless. Always compare within the same sector: Apple to Microsoft, Saudi Aramco to ExxonMobil, Al Rajhi Bank to other GCC Islamic banks.
When a High P/E Is Justified — and When It Is a Warning
When a High P/E Makes Sense
A high P/E means investors expect significant future earnings growth. If a company is growing earnings at 30-40% per year, paying 40x trailing earnings may actually be cheap relative to future earnings power. NVIDIA's P/E has ranged between 35x and 60x during the AI acceleration period, at first glance extremely expensive, but justified by earnings that were literally doubling year over year due to AI chip demand.
Data from over 17,000 public companies illustrates that S&P 500 stocks with a projected P/E ratio of less than 15 (for comparison, the average for the index is 22) have produced average annual compounded returns of about 14.2% from 2010-2025. This provides proof of the significance of relative valuations based on historical relative pricing when determining future valuation-based returns.
When a Low P/E Is a Value Trap, Not an Opportunity
A low price-to-earnings ratio (P/E) can create the impression of an undervalued stock; however, many companies have low P/E ratios due to poor fundamentals and that will lead to continued weak earnings and subsequently falling prices. One type of stock that has a low P/E due to low future fundamental growth rates are called value traps as the market has already priced in these factors at the time of purchase and will subsequently decline in value as the fundamentals decline further and investor expectations are not met.
Related: Best Stocks for Beginners to Buy in Saudi Arabia: Top Picks for 2026
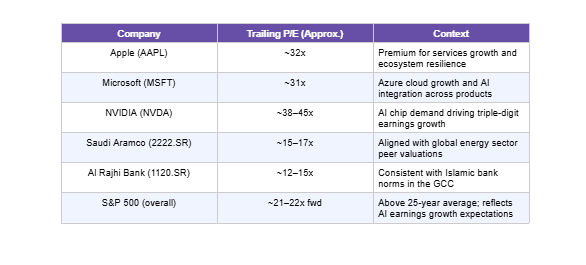
P/E Ratios of Key Stocks Saudi Investors Follow (Early 2026)
Practical Four-Step P/E Application for Saudi Investors
Find the stock's current P/E — available on Google Finance, Yahoo Finance, Bloomberg, or directly within Raseed in seconds.
Compare to the company's own 5-year historical average, available on Macrotrends.net. A company trading below its own historical P/E average may be attractively valued.
Compare to sector peers only — Apple to Microsoft, Aramco to ExxonMobil. Cross-sector P/E comparison is meaningless.
Check the forward P/E for growth context, if trailing P/E seems high, the forward P/E based on analyst estimates may tell a more accurate story about current value.
Disclaimer: P/E ratios referenced are approximate figures as of early 2026 based on publicly available data. All investing involves risk. This does not constitute financial advice or a recommendation to buy or sell any security. Past performance does not guarantee future results. Securities brokerage services are provided by Fullerverse (SC) Limited, licensed and regulated by the Financial Services Authority Seychelles (Licence No. SD152), a wholly-owned subsidiary of Raseed Invest Inc. Capital is at risk.