


A 10-Year Performance Comparison for GCC Investors
Quick Answer: How Has TASI Compared to the S&P 500 Over 10 Years?
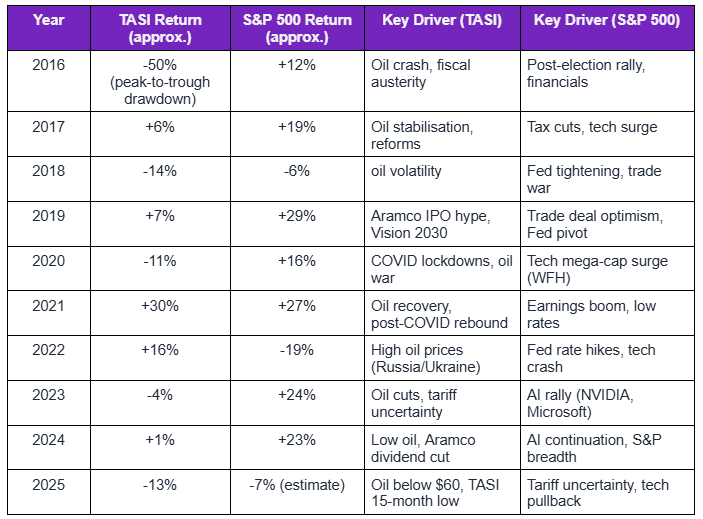
The S&P 500 significantly outperformed TASI over the 10-year period 2016–2026, delivering higher cumulative returns with lower oil-price-linked volatility
TASI's deepest drawdown exceeded 50% in 2016 when oil collapsed — the S&P 500's worst drawdown in the same period was approximately 34% in the 2020 COVID crash
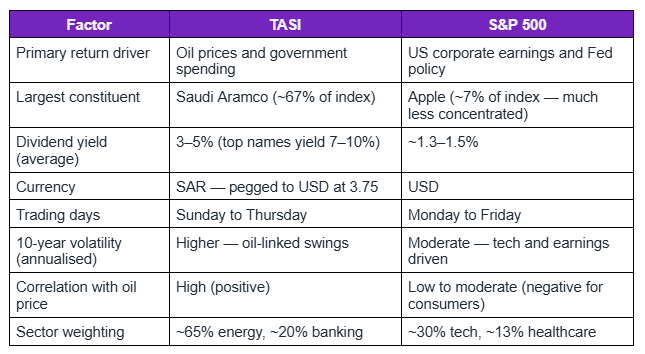
TASI offers higher dividend yields on average than the S&P 500, with several large constituents yielding 7–10%
TASI and the S&P 500 are largely uncorrelated — TASI follows oil prices and regional geopolitics, the S&P 500 follows US tech earnings and Fed policy
A GCC investor holding both gains diversification: TASI adds oil price exposure and SAR-denominated income; the S&P 500 adds USD growth and tech sector exposure
What you will learn in this article
The annual return of TASI vs S&P 500 for each year from 2016 to 2026
The key drivers behind each index's performance
Volatility, drawdowns, and dividend yield differences
What the 10-year data means for your Saudi/GCC portfolio allocation
The practical case for holding both, not choosing one
The S&P 500 outperformed TASI over the 10-year period from 2016 to 2026, but the comparison is more nuanced than a simple returns number suggests.
TASI and the S&P 500 are fundamentally different indices driven by different economic forces. TASI's performance is primarily linked to oil prices, Saudi government spending, and regional geopolitical stability. The S&P 500 is driven primarily by US corporate earnings, Federal Reserve monetary policy, and the performance of its mega-cap technology constituents.
Comparing them helps GCC investors understand not just which market performed better, but why and how owning both can produce a more resilient portfolio than choosing either alone. See also our guide to TASI vs US Stocks: Where Should Saudi Investors Put Their Money? for a decision-focused comparison.
Year-by-Year Performance: TASI vs S&P 500 (2016–2025)
Both indices had strong years and weak years but their cycles are driven by entirely different forces.
Key Structural Differences Between TASI and the S&P 500
Understanding why the returns differ is more useful than the returns themselves.
TASI's Structural Advantages for Saudi Investors
TASI offers three things the S&P 500 cannot: oil price hedge, SAR-denominated dividends, and domestic economic alignment.
For a Saudi investor earning in SAR, TASI stocks pay dividends in SAR without currency conversion risk. For a Muslim investor, many TASI constituents, particularly the Islamic banks, are structurally Sharia-compliant. For an investor who understands Saudi macroeconomics and Vision 2030, TASI's domestic focus can be an advantage.
TASI also historically moves counter-cyclically to global tech-driven markets. In 2022, when the S&P 500 fell 19% on Fed rate hikes, TASI rose 16% driven by high oil prices from the Russia-Ukraine conflict. This natural hedge is structurally valuable in a mixed portfolio.
GCC context: Because the SAR is pegged to the USD at a fixed 3.75 rate, GCC investors in TASI effectively eliminate currency risk on their Saudi holdings. US stock gains in USD translate directly back to SAR at the same rate, which means TASI and S&P 500 returns can be compared without currency adjustment for most GCC-based investors.
Build a portfolio that includes both TASI and S&P 500 stocks on one Raseed account, fees capped at $3. → Access TASI and US stocks on Raseed →
Should You Hold TASI or the S&P 500 — or Both?
The 10-year data suggests the most resilient GCC portfolio holds both, not one or the other.
TASI gives you oil price alignment, SAR income, and domestic Vision 2030 growth exposure. The S&P 500 gives you USD growth, tech sector returns, and global company diversification unavailable in Saudi markets. A portfolio holding 40–60% Saudi equities for domestic grounding and 40–60% US equities for growth has historically provided better risk-adjusted returns than a pure commitment to either market.
Frequently Asked Questions
Q: Has TASI ever outperformed the S&P 500?
Yes. In years of high oil prices, TASI has significantly outperformed. In 2022, TASI gained 16% while the S&P 500 fell 19%. In 2021, both gained approximately 27–30%. TASI's outperformance tends to coincide with oil above $80/barrel and rising Saudi government spending.
Q: Is it riskier to invest in TASI or the S&P 500?
TASI has historically been more volatile, largely due to its concentrated exposure to oil prices through Aramco's dominance. The S&P 500 is diversified across 500 companies in multiple sectors, though it carries significant tech concentration risk. Neither is inherently safer — they carry different types of risk.
Q: Can I invest in the S&P 500 index from Saudi Arabia?
Yes. Eligible investors in Saudi Arabia may be able to access S&P 500 exposure through ETFs or similar investment products, depending on product availability and the terms shown in the app.
Q: What is TASI's best 12-month return in the past 10 years?
TASI's strongest single-year performance in the 2016–2025 period was approximately 2021, when it gained around 30%, driven by oil price recovery from COVID lows and strong banking sector earnings as Saudi economic activity rebounded.
Related Articles on Raseed Learn
TASI vs US Stocks — Full Decision Guide
Best TASI Sectors to Invest In
Understanding Risk in Stock Trading
5 Steps to Diversify Your Portfolio
This article is for educational and informational purposes only and does not constitute investment advice. All investing involves risk, including the potential loss of principal. Data is from publicly available sources as of June 2026. Past performance does not guarantee future results. Securities brokerage services are provided by Fullerverse (SC) Limited, licensed and regulated by the Financial Services Authority Seychelles (Licence No. SD152), a wholly-owned subsidiary of Raseed Invest Inc. Raseed Invest Limited is regulated by the DFSA. Capital is at risk.