The Indicator Most Traders Underestimate: Volume as the Real Market Signal
When most people think about trading, the first thing they focus on is price. A stock is up 5%. A stock broke through $150. A stock is at its 52-week high. Price gets all the attention. But for traders who operate on shorter time horizons, whether that is intraday, a few days, or a week, volume is frequently a more valuable and reliable leading indicator than price alone.
Learning about how volume is more important than price in short-term trading, using volume data to confirm moves, detect reversals, and avoid false breakouts will be among the most impactful improvements any trader can make when developing their active trading methodology. This guide provides the fundamentals on the theoretical foundations, practical applications, and specific patterns that make up volume-based analysis.
Related: Liquidity, Volume and Volatility: What Day Traders in Saudi Arabia Watch First
Price Is the What. Volume Is the Why.
The most fundamental reason volume matters more than price in short-term trading is this: price tells you what happened, while volume tells you why it happened and how likely it is to continue.
As an example, imagine two scenarios: One scenario shows a stock price increasing by 3% in a single session with 50% of the average trading volume (meaning fewer people participated in this increase). The other scenario shows the same stock increasing by 3% with 300% of the average trading volume (meaning 3x more people participated). While both scenarios create the same price change, the first scenario is less stable and more likely to reverse, while the second scenario demonstrates higher levels of confidence and will likely continue to move in that direction.
Volume is a direct measure of participation and conviction. High volume behind a move validates it. Low volume behind a move questions it. This single principle, consistently applied, eliminates a large proportion of bad trade entries.
The Four Core Volume Principles Every Short-Term Trader Should Know
1. Volume Confirms Price Direction
A price move supported by above-average volume is more likely to be genuine and sustainable than one occurring on below-average volume. This applies equally to moves up and down. A stock breaking to new highs on heavy volume is a stronger signal than the same breakout on thin volume. A stock selling off sharply on high volume is warning of genuine distribution, not just noise.
2. Volume Precedes Price Reversals
One of the most powerful applications of volume analysis is identifying potential trend reversals before they are visible in price action. When a stock has been rising steadily and then shows a sudden spike in volume without a corresponding price increase or actually sees price decline on very high volume, it suggests large participants are selling into buying pressure. This is called distribution, and it often precedes significant price reversals.
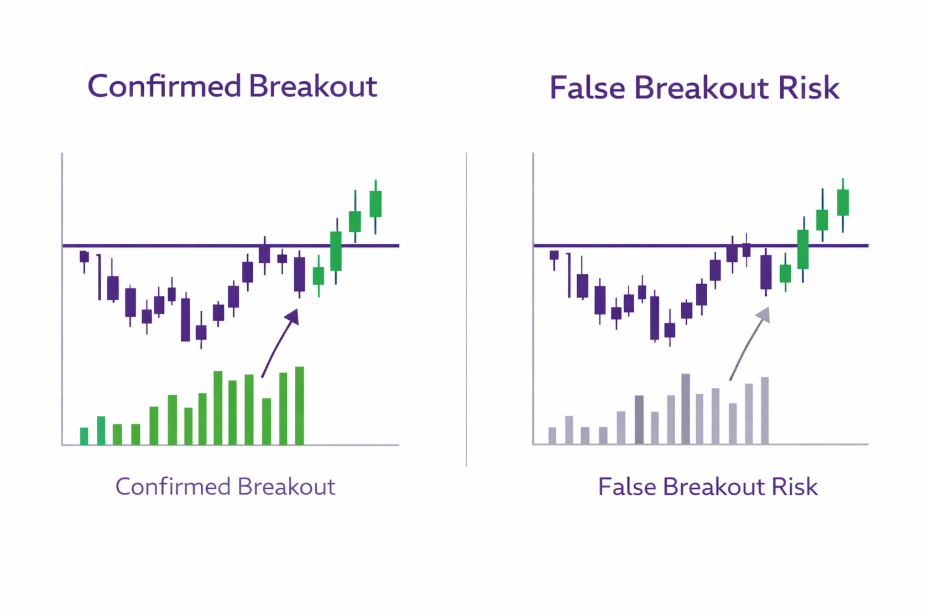
3. Breakouts on High Volume Are More Reliable
When a price crosses over an important level of support or resistance from one side to another, it is crucial for traders to analyze the volume of shares traded during this event. Volume levels can indicate whether the breakout has real momentum or not. Breakouts supported by twice as many shares as normally trade have much greater likelihoods of continuation than breakouts with low volumes, which often return to their original price ranges (false).
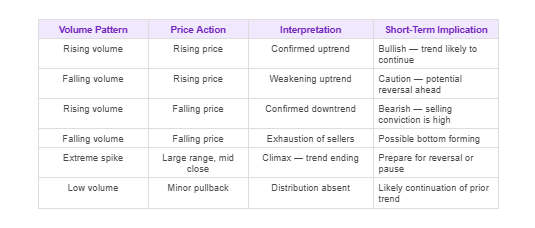
4. Divergence Between Price and Volume Is a Warning Signal
Diverging prices and volumes (e.g., price higher, volume lower or price lower, volume lower) signal a lack of conviction in the trend direction. Rising prices with falling volume often lead to a plateau or a reversal; on the contrary, falling prices with falling volume often indicate that selling is becoming exhausted. Divergences are an early warning sign to indicate when the market is about to change prices.
Related: Advanced Charts & Order Book on Raseed: Trading With Clarity
Volume Analysis in Practice: Reading the Signals
The three most actionable volume patterns for short-term traders are as follows:
Climax Volume: An extremely high volume session often 5–10x average that frequently signals the end of a trend rather than its continuation. When a stock has been trending for several sessions and then surges on extreme volume with a wide price range but closes near the middle of its range, this is often exhaustion buying or selling. The trend is likely ending.
Accumulation on Rising Volume: A series of sessions where volume increases progressively while price moves up in an orderly fashion. This pattern indicates systematic buying from informed or institutional participants and is one of the strongest continuation signals in technical analysis.
Low-Volume Pullbacks: When a stock in an uptrend experiences a brief price decline on significantly below-average volume, it suggests sellers lack conviction and the pullback is likely temporary rather than the start of a larger move down. These are often high-quality re-entry opportunities.
Related: Free Level 2 Market Data: Why It Matters in GCC
Why Volume Matters Especially for Saudi and GCC Traders in US Markets
Saudi and GCC traders operating in US markets face a specific challenge: the regular US trading session runs from 4:30 PM to 11:00 PM Saudi Arabia Standard Time, meaning the busiest and highest-volume periods of the US trading day, the opening 30 minutes and the final 30 minutes, occur in the Saudi evening. Understanding how volume is distributed across the session helps traders decide when to be most actively engaged.
The first 30 minutes after market open (4:30 to 5:00 PM SAST) and the final 30 minutes before close (10:30 to 11:00 PM SAST) carry the highest volume of any part of the session. These windows also carry the widest bid-ask spreads and the most volatile price action. Many short-term traders prefer to let the opening volatility settle (the first 15 minutes) before engaging, then trade during the more liquid mid-morning period.
Related: Can I Trade US Stocks at Night from Saudi Arabia?
Tools for Volume Analysis on Raseed
Raseed provides real-time Level 2 market data, the complete order book, to all users at no additional cost. The order book shows not just the current price but the volume sitting at each price level above and below the market. This is the richest possible volume information: not just how much has traded, but how much is waiting to trade at every nearby price point.
You can use the tools used by institutional traders to make their volume-based decisions by combining the raw on-Order Book data with Raseed’s advanced charting suite. The charting suite has Volume Bars and Moving Averages of Volume, both of which will help you develop a more comprehensive understanding of Volume, as well as VWAP.
Related: Advanced Charts & Order Book on Raseed: Trading With Clarity
Frequently Asked Questions: Volume in Short-Term Trading
Is high volume always a good sign for a stock?
Not necessarily. High volume confirms the significance of a price move in either direction. A stock falling sharply on high volume is confirming strong selling conviction, which is a negative signal, not a positive one. The direction of the move and its context matter as much as the volume level.
What is VWAP and why do short-term traders use it?
Volume weighted average price (VWAP) represents a volume weighted average price that has occurred over an entire trading day. It very often serves as both a benchmark used by investment professionals as well as dynamic support and resistance levels for traders. Stocks that are traded above their VWAP are said to be in a bullish, intraday position while those that are traded below it are said to be in a bearish intraday position.
How does Raseed's Level 2 data help with volume analysis?
Level 2 data shows the full order book of all bids and asks with their sizes giving you a real-time view of where volume is queued to trade. Seeing a wall of large bid orders below the current price is a form of volume information that tells you there is significant buying interest supporting the stock at that level. This depth-of-market view is available to all Raseed users, free of charge.
Securities brokerage services are provided by Fullerverse (SC) Limited, a security broker dealer licensed and regulated by the Financial Services Authority Seychelles (Licence No. SD152). Fullerverse is a wholly-owned subsidiary of Raseed Invest Inc. All investing involves risk. Past performance does not guarantee future results. Capital is at risk.